Motorsport Telemetry·2023
Pitlane
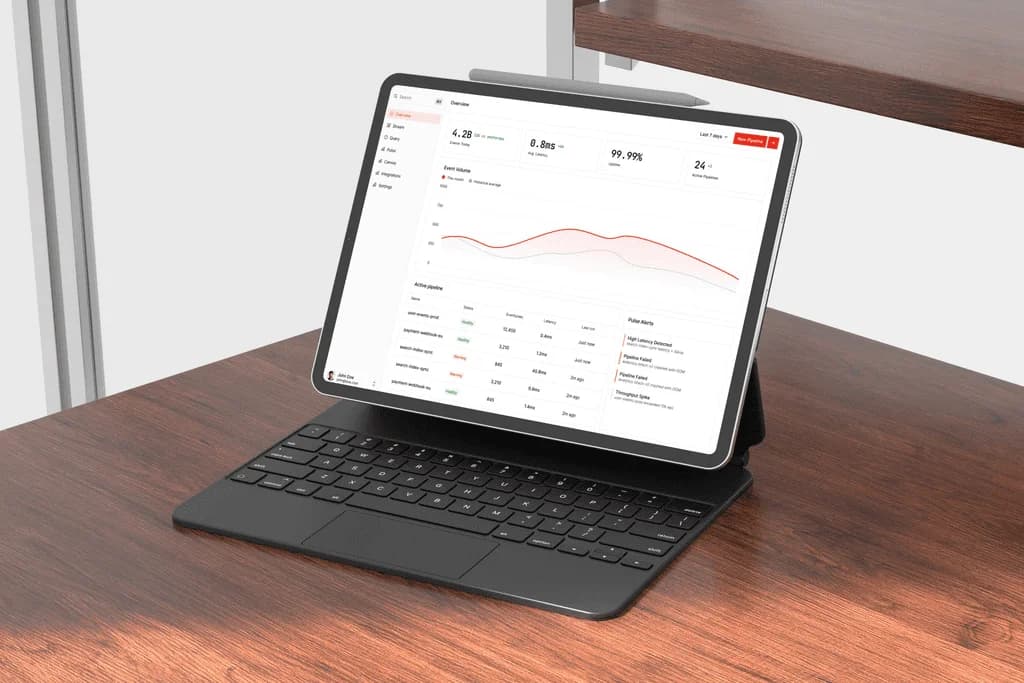
Visit websiteReal-time telemetry dashboard designed for race engineers to monitor engine health, tire wear, and track conditions during live sessions.
The Problem
Race telemetry produces hundreds of thousands of sensor readings per second, making critical anomalies easy to miss in standard tools.
The Solution
Built custom canvas charts that render 60 FPS live streams with automated visual alerts for temperature and pressure spikes.
Key Highlights
Smooth 60 FPS data visualization with zero lag or frame drops
Customizable engineer dashboards with drag-and-drop telemetry widgets
Instant anomaly alerts for powertrain and tire degradation
Technologies & Architecture
5 core toolsNext.js
TypeScript
Canvas API
Redis
SSE